
Reaction Profiles
REACTION PROFILES are graphs that show how ENERGY CHANGES throughout a reaction.
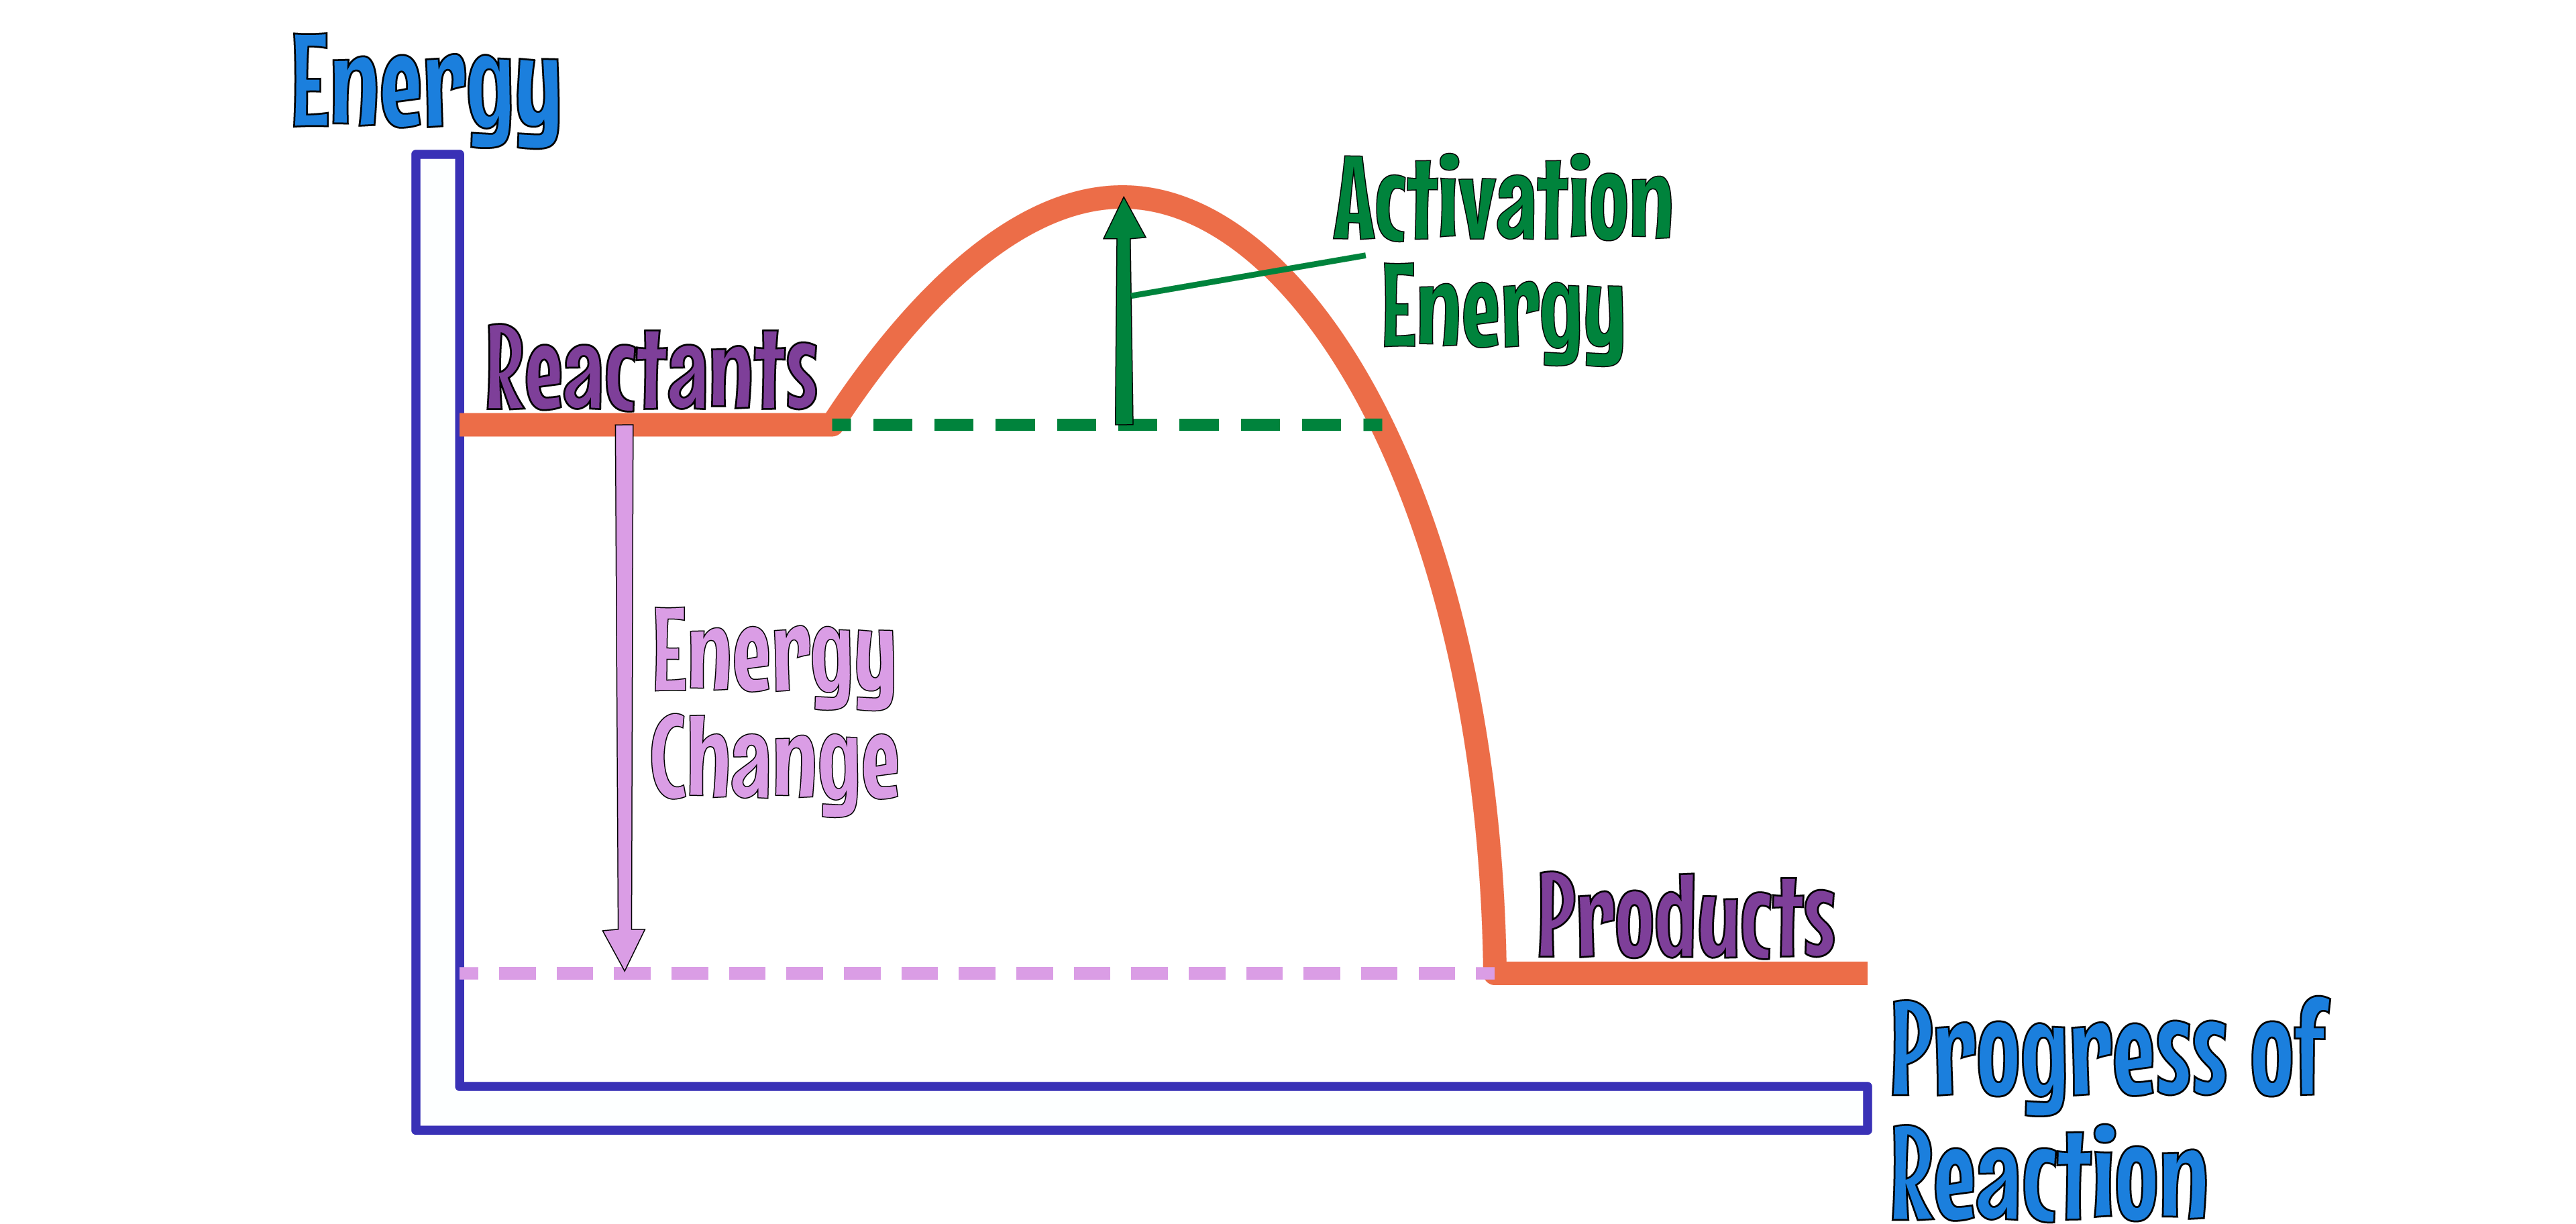
The Y-AXIS represents the ENERGY and the X-AXIS represents the PROGRESS OF REACTION.
The difference in HEIGHT between the REACTANTS and PRODUCTS represents the OVERALL ENERGY CHANGE of the reaction.
The curved lined between the reactants and products represents how the energy changes as the reaction proceeds.
The difference in height between the REACTANTS and the PEAK of the graph represents the ACTIVATION ENERGY.
ACTIVATION ENERGY
Chemical reactions can occur only when reacting particles collide with each other and with SUFFICIENT ENERGY.
The ACTIVATION ENERGY represents the MINIMUM ENERGY needed for reactant particles to COLLIDE with each other, in order to REACT.
The BIGGER the activation energy peak, the greater the ACTIVATION ENERGY.
EXOTHERMIC AND ENDOTHERMIC REACTION PROFILES
Both exothermic and endothermic reactions have different reaction profiles.
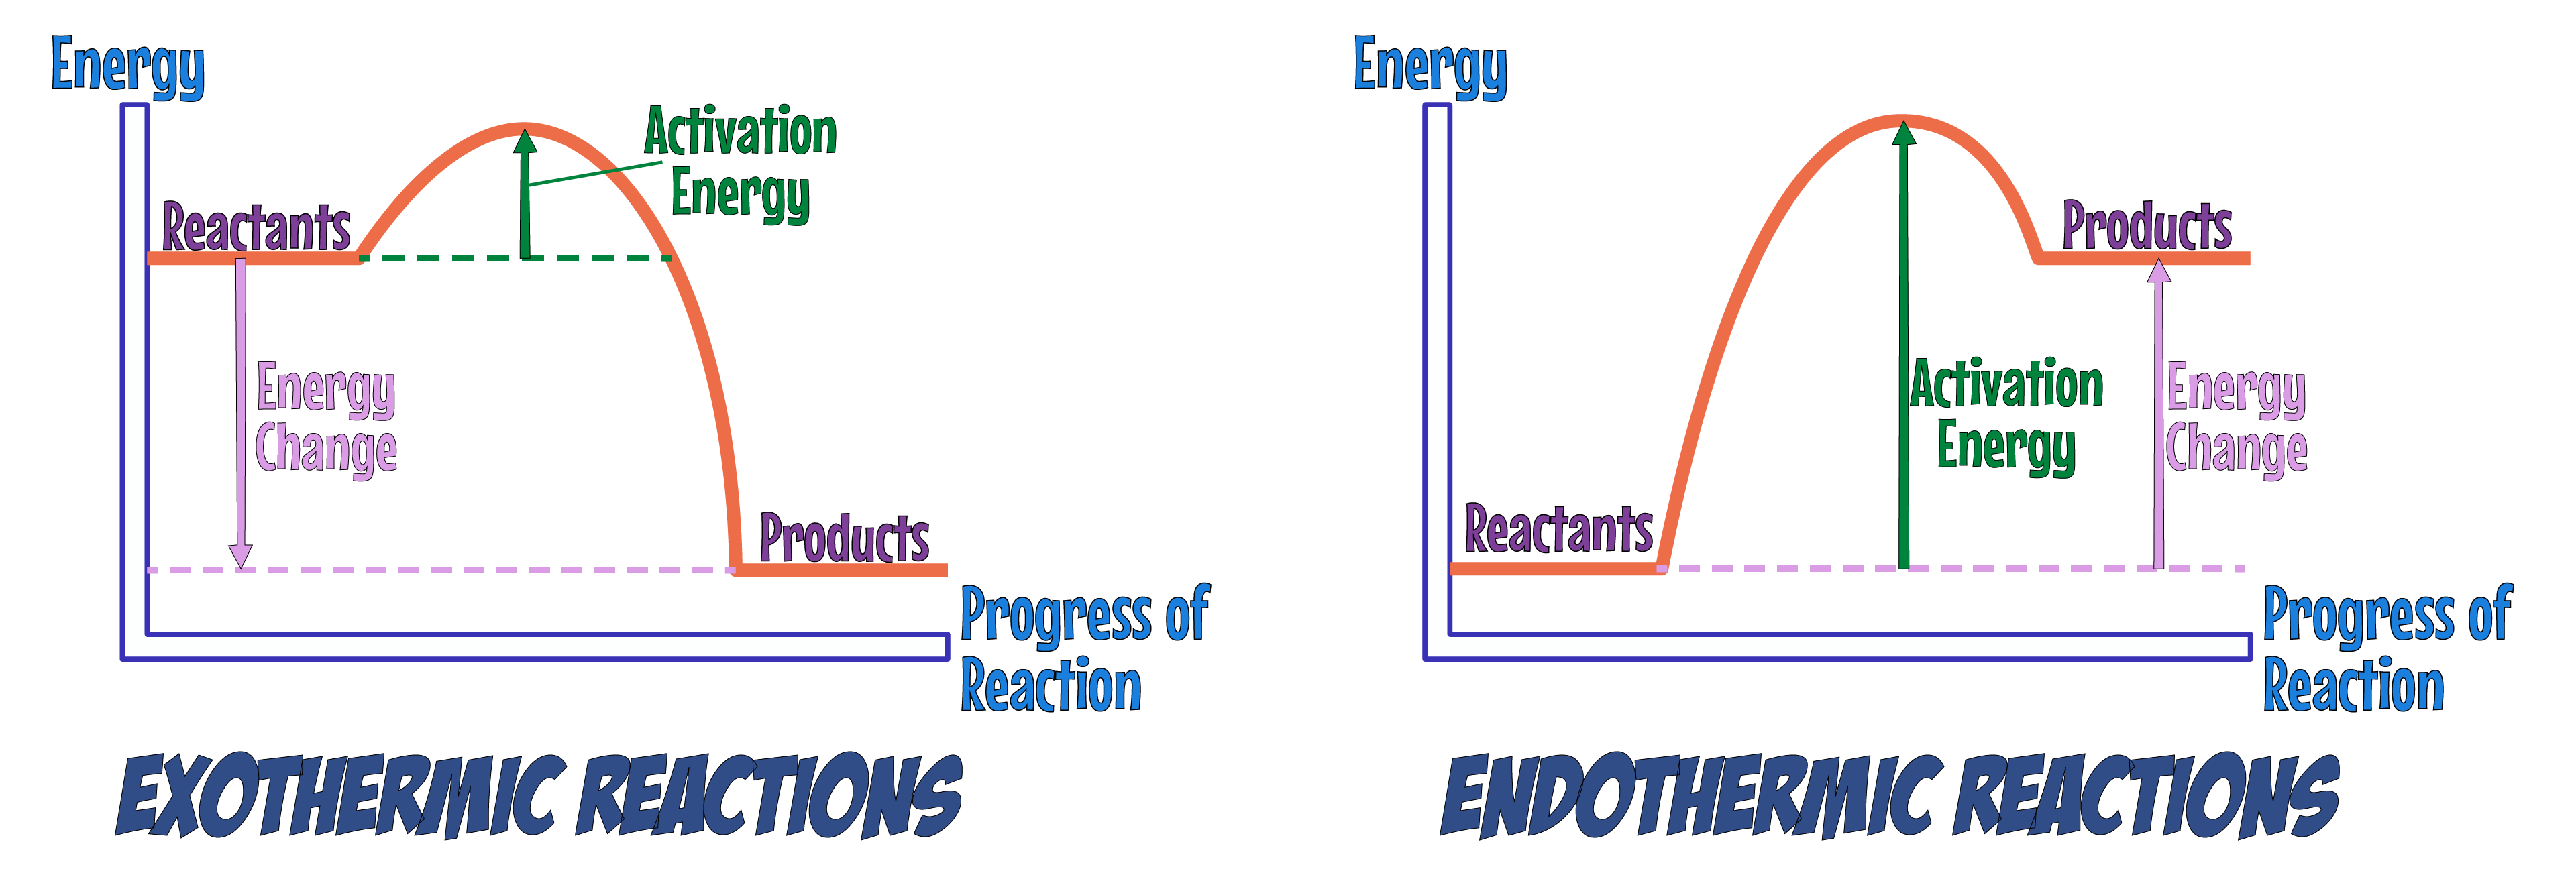
EXOTHERMIC REACTIONS:
- These RELEASE ENERGY, with products having a LOWER ENERGY than reactants.
- ENERGY RELEASED is shown as a DROP in energy.
ENDOTHERMIC REACTIONS:
- These absorb energy, resulting in products at a HIGHER ENERGY LEVEL than reactants.
- ENERGY ABSORBED is shown by a RISE in energy.