
Half Lives
Random Nature of Radioactivity
Radioactive decay involves an UNSTABLE NUCLEUS giving off RADIATION in order to become STABLE.
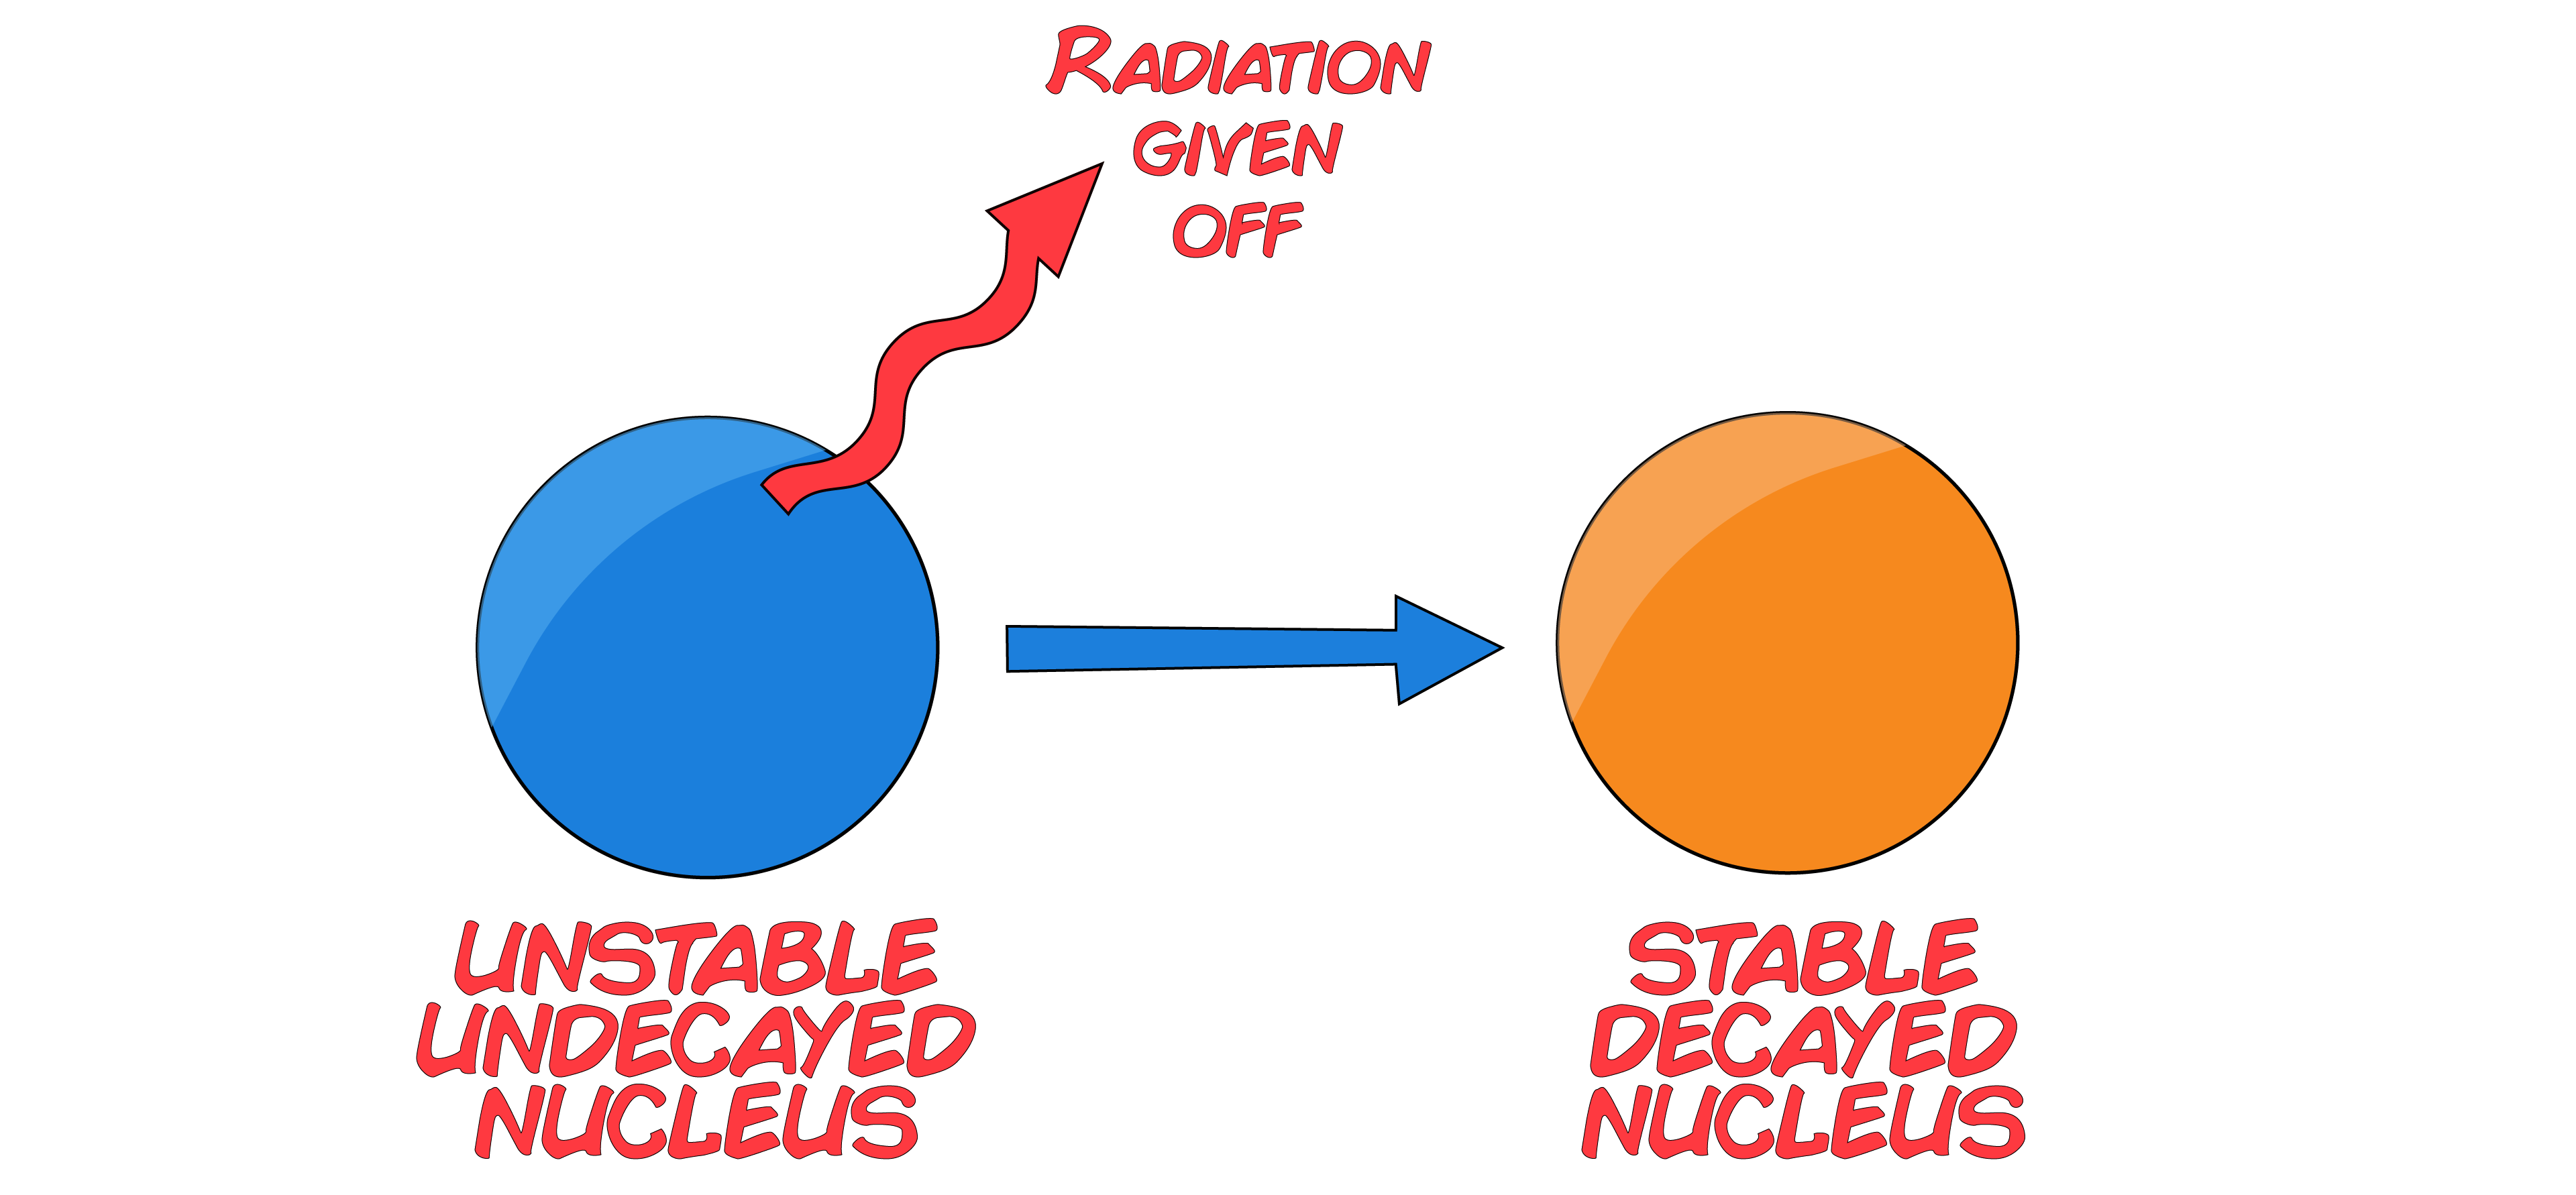
This process is described as RANDOM. This is because it’s IMPOSSIBLE to predict WHEN a nucleus will DECAY and WHICH nucleus in a sample will decay next.

If we looked at an example of 32 nuclei of a RADIOACTIVE ISOTOPE, it is impossible to predict WHICH of the 32 nuclei would decay next. It is also impossible to predict WHEN a nucleus will decay next.
Every time a decay occurs a random nucleus in the isotope gives off RADIATION and becomes STABLE. This usually changes the isotope to another element.
The number of UNDECAYED nuclei DECREASES over time and the number of DECAYED nuclei INCREASES over time.
This occurs until ALL nuclei DECAY and become STABLE.
Dice Analogy

A good way to model the RANDOM NATURE of radioactive decay is by using DICE as the isotope's NUCLEI.
If every time you roll a '6' counted as a NUCLEUS DECAYING, you could say that there is a 1 in 6 chance of the nucleus decaying.
If you rolled 100 dice, you still would not be able to predict WHICH dice would roll a '6' or WHEN a dice would roll a '6'.
Half Life
The activity of a radioactive sample always DECREASES over time. This is because it becomes LESS likely for a decay to occur as there are FEWER UNDECAYED nuclei after every DECAY.
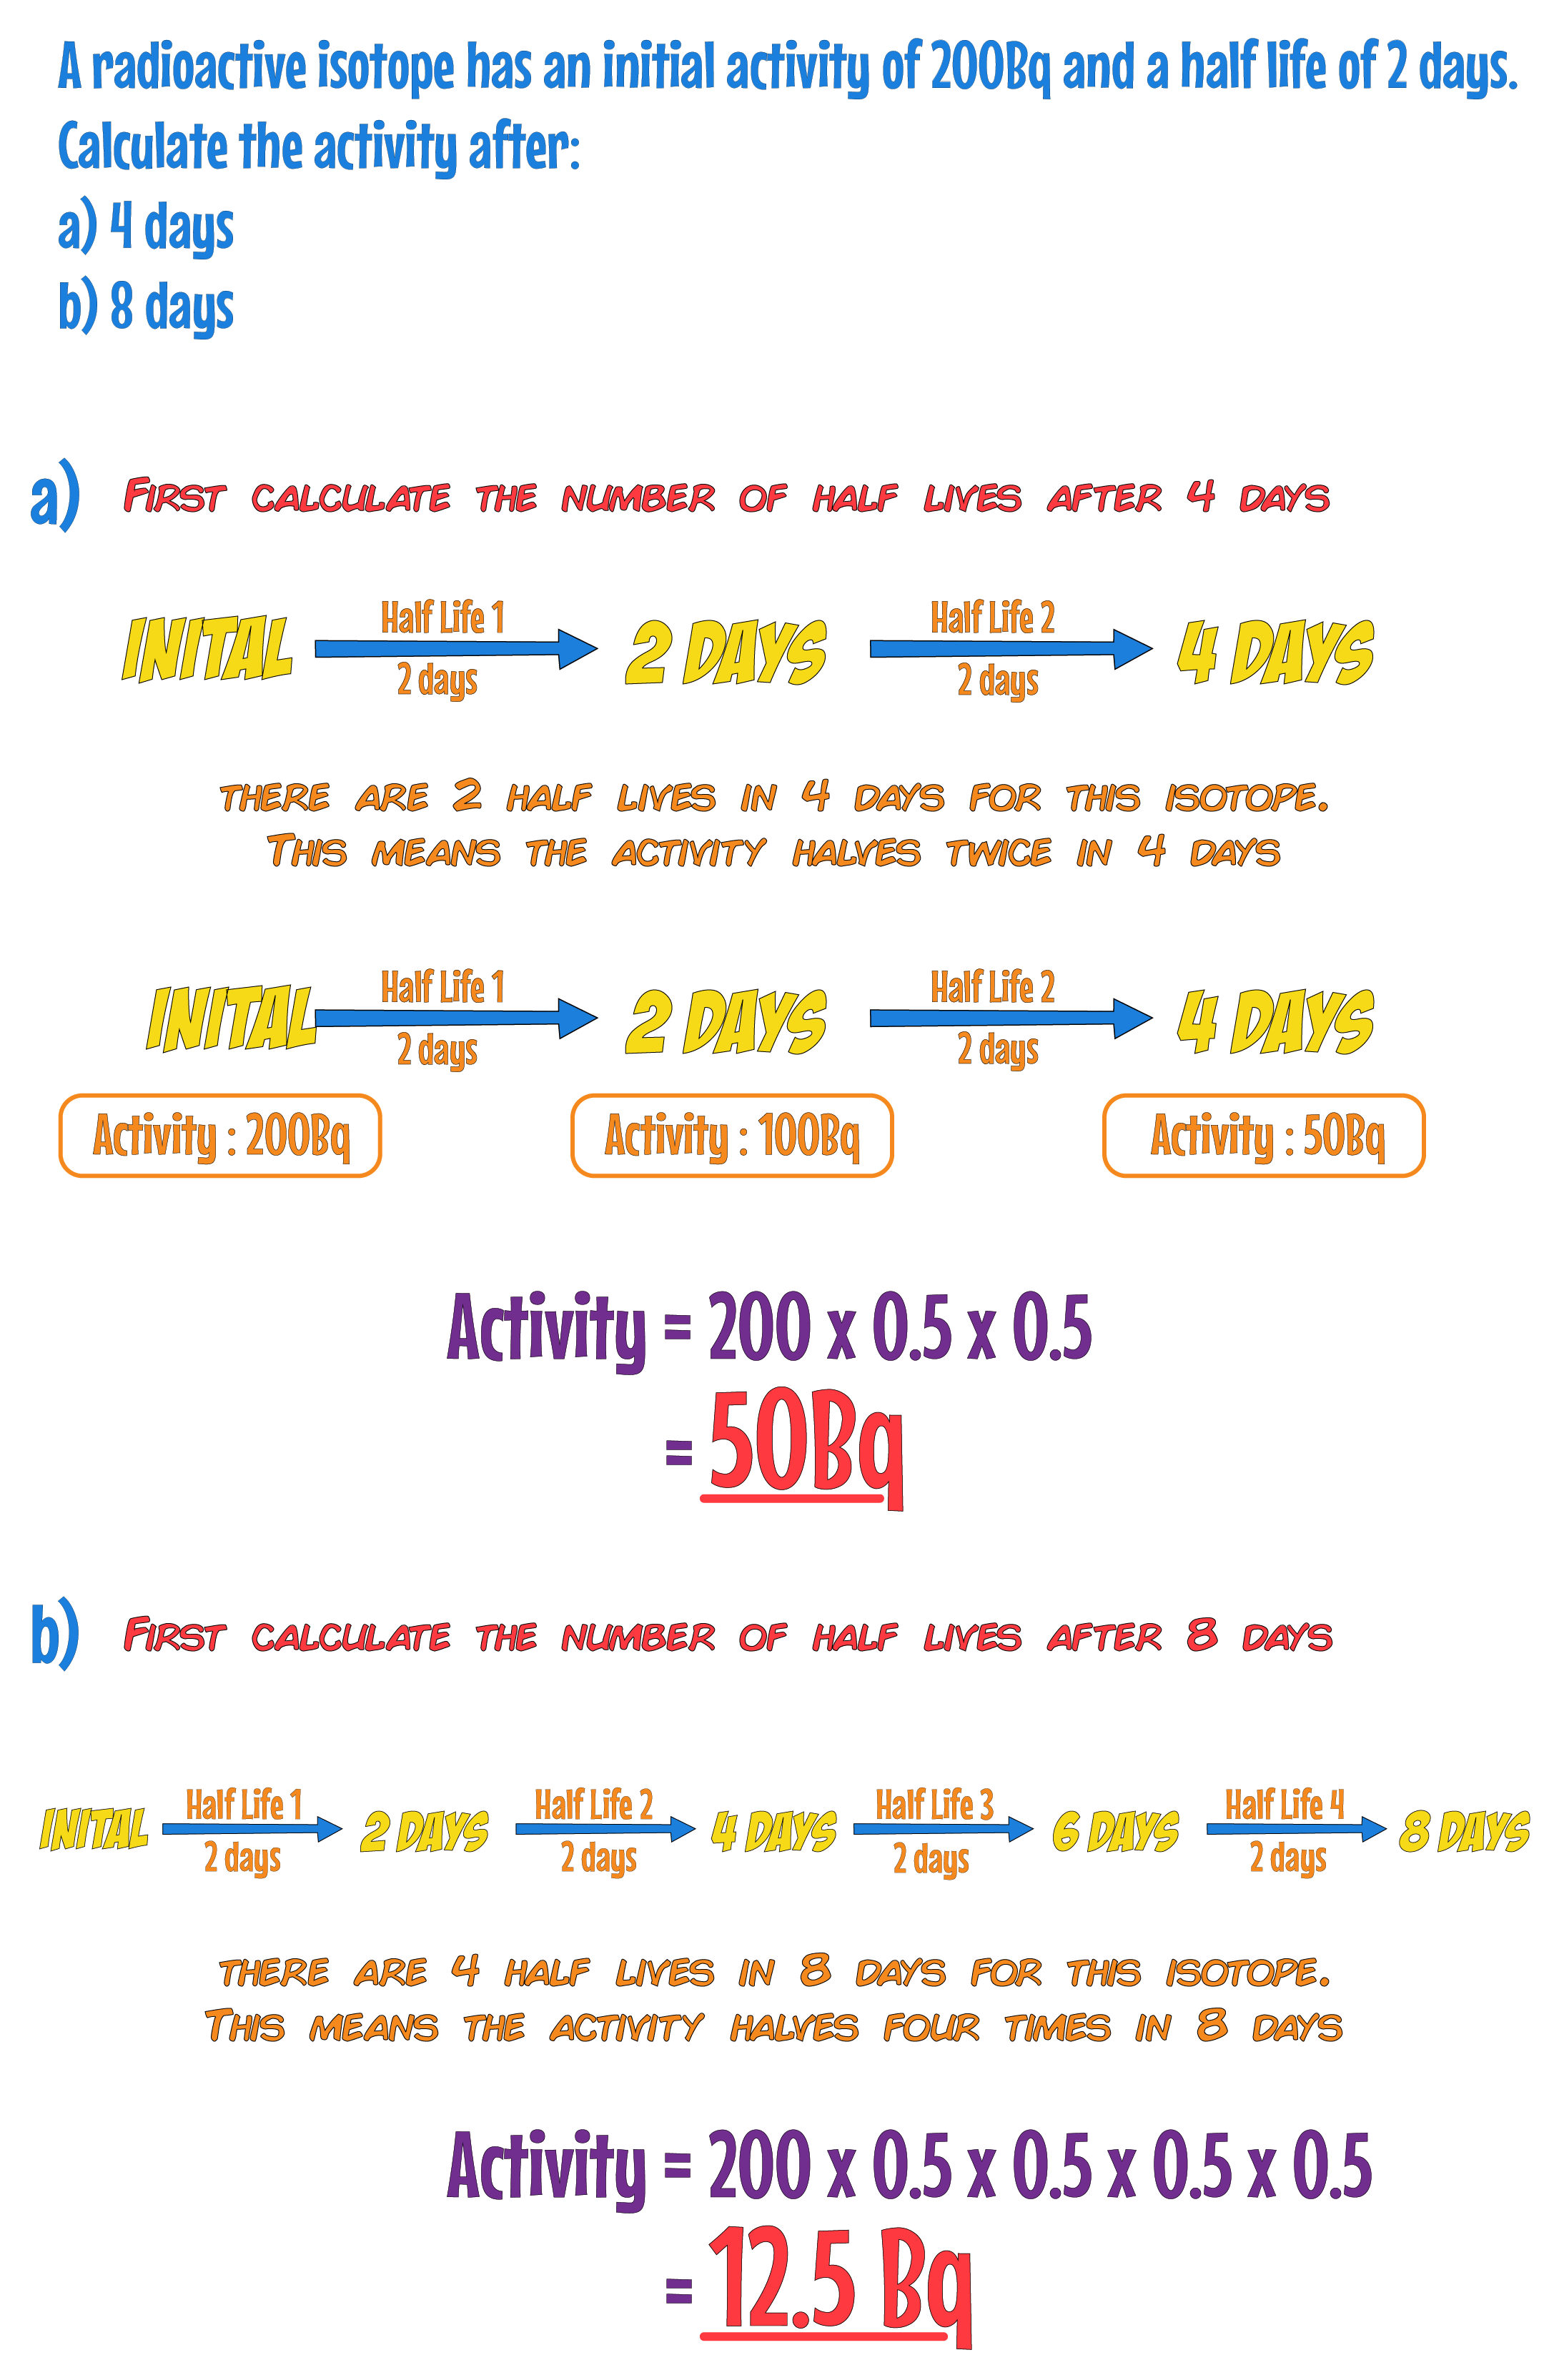
The TIME it takes the ACTIVITY or the NUMBER of UNDECAYED NUCLEI to decrease to HALF of the ORIGINAL value is known as the HALF LIFE.
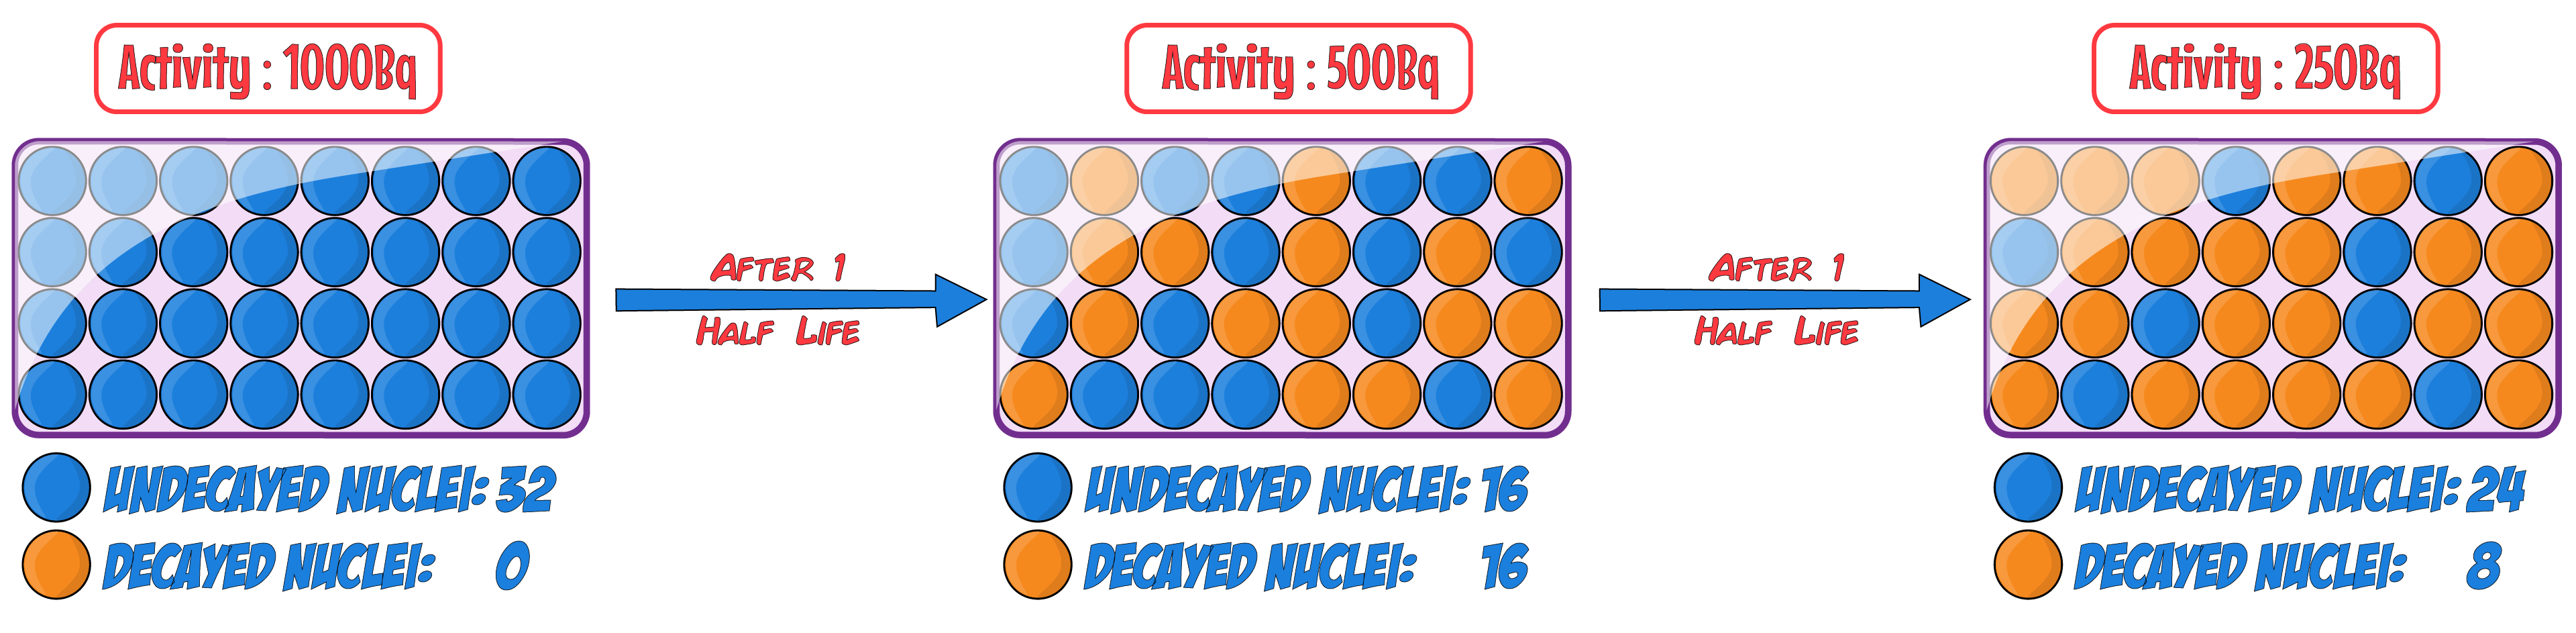
The half-life of a radioactive isotope can be DEFINED in TWO ways:
1. The time it takes for the number of UNDECAYED NUCLEI of an isotope in a sample to HALVE.
2. The time it takes for the COUNT RATE (or ACTIVITY) from a sample containing the isotope to fall to HALF its initial level.
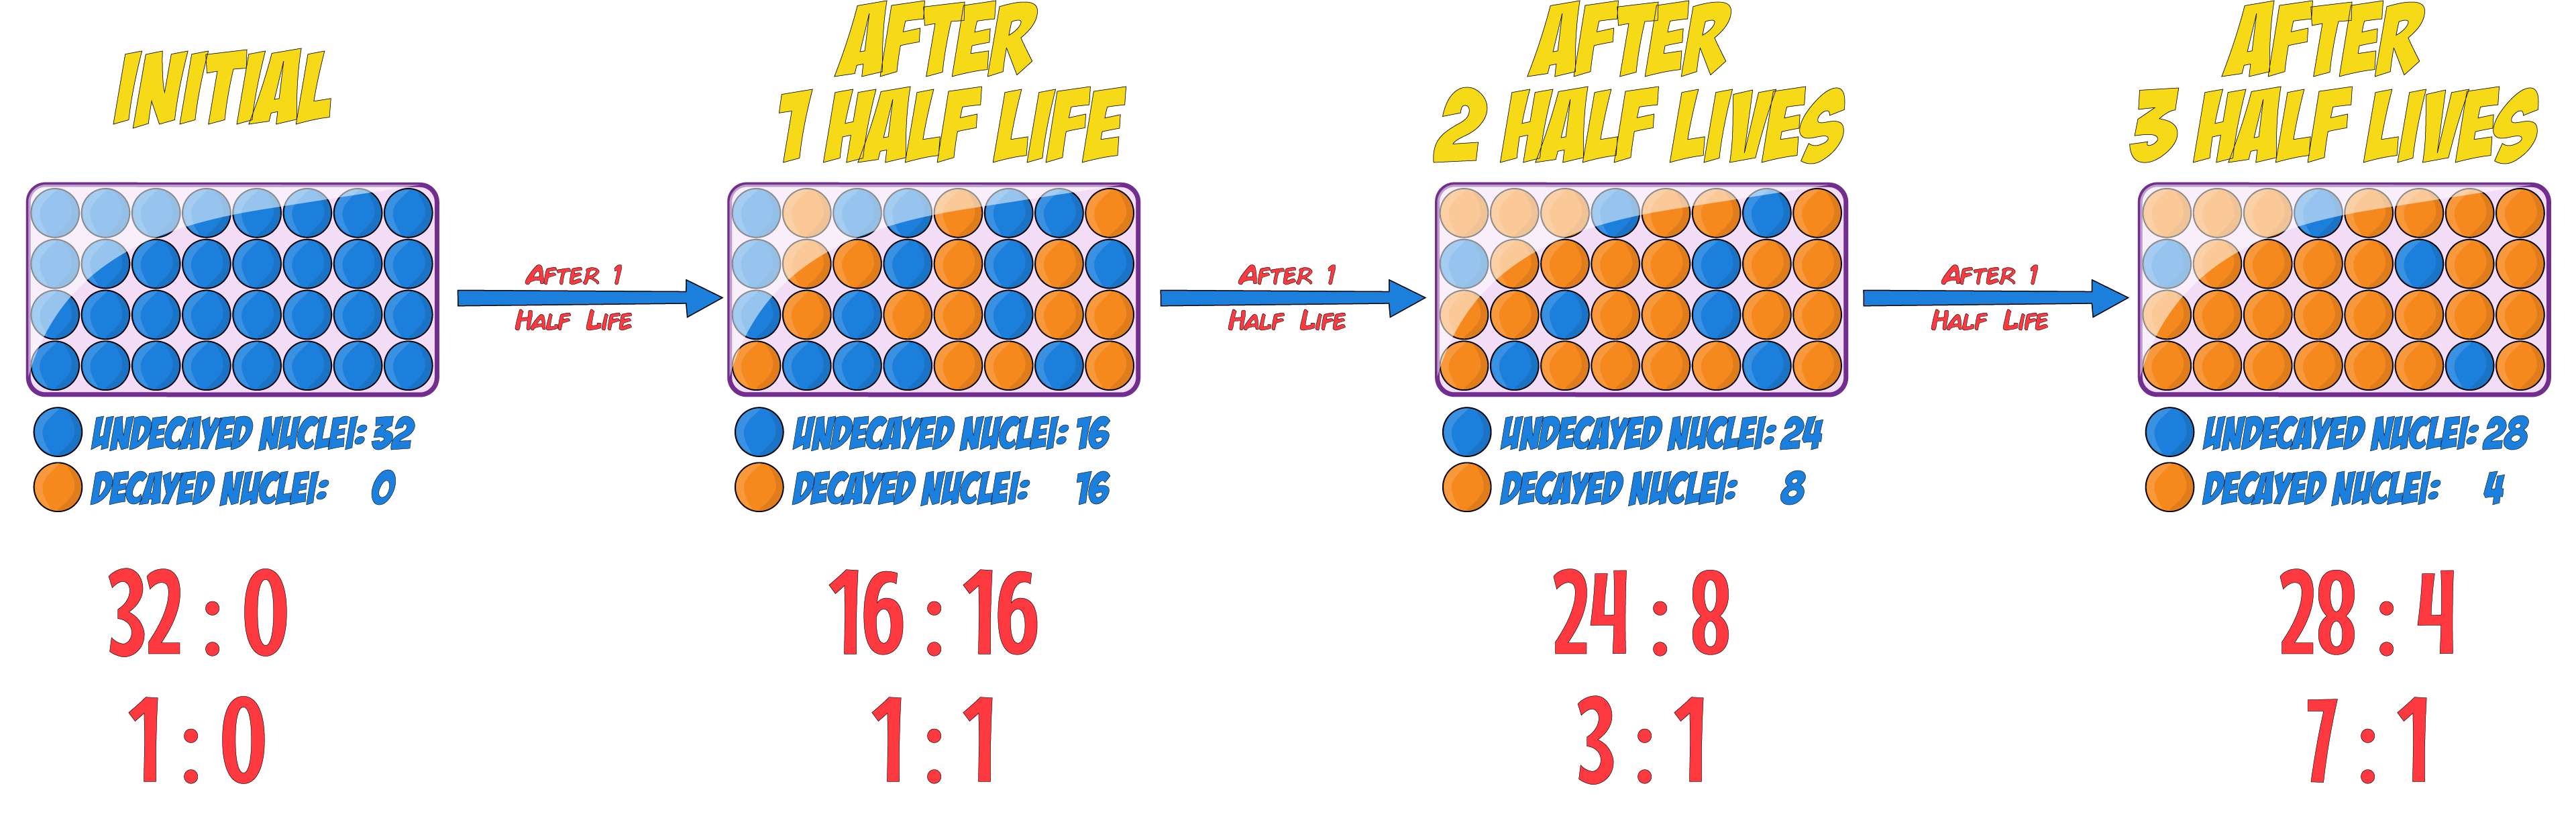
You can also express the nuclei as a RATIO of UNDECAYED to DECAYED nuclei:
Half Life in Graphs
The ACTIVITY, COUNT-RATE or NUMBER OF UNDECAYED NUCLEI can all be represented on a graph as a DECREASING curve.
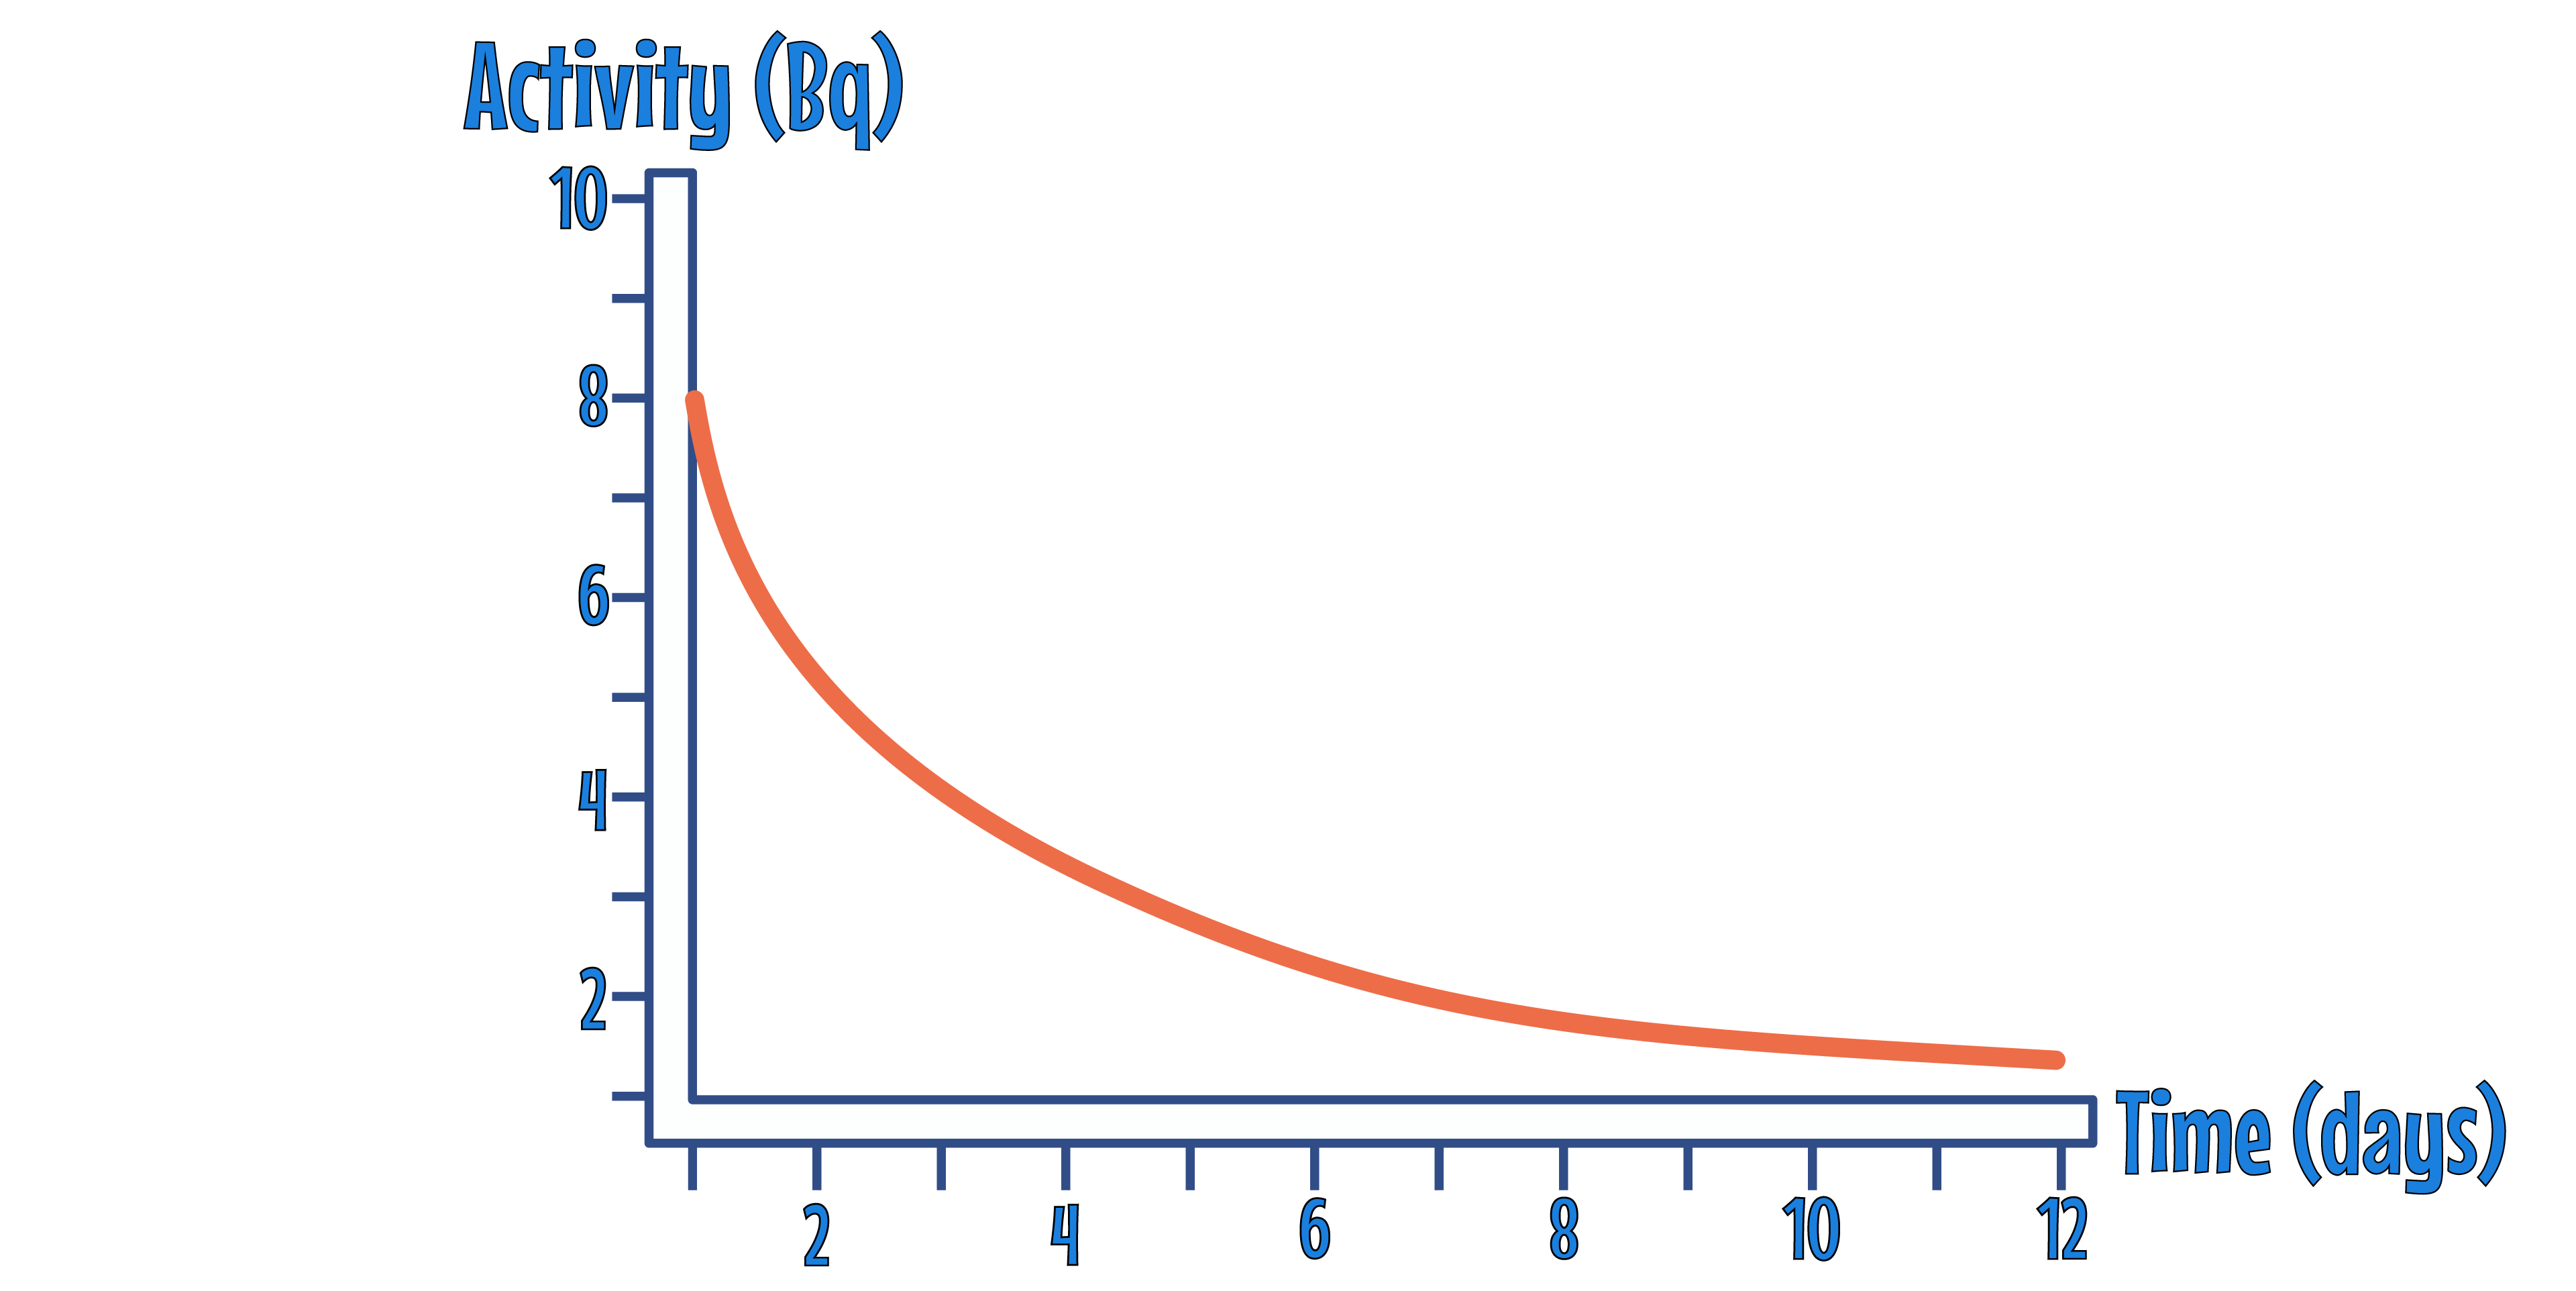
The half life of the sample can be found by finding the time taken for the INITIAL VALUE to halve.
To do this, find the INITIAL VALUE on the y-axis and HALVE it.
Then draw a HORIZONTAL LINE from the half value to the curve, and draw a VERTICAL LINE from the curve to the x-axis.
The time you find on the x-axis is the HALF LIFE.
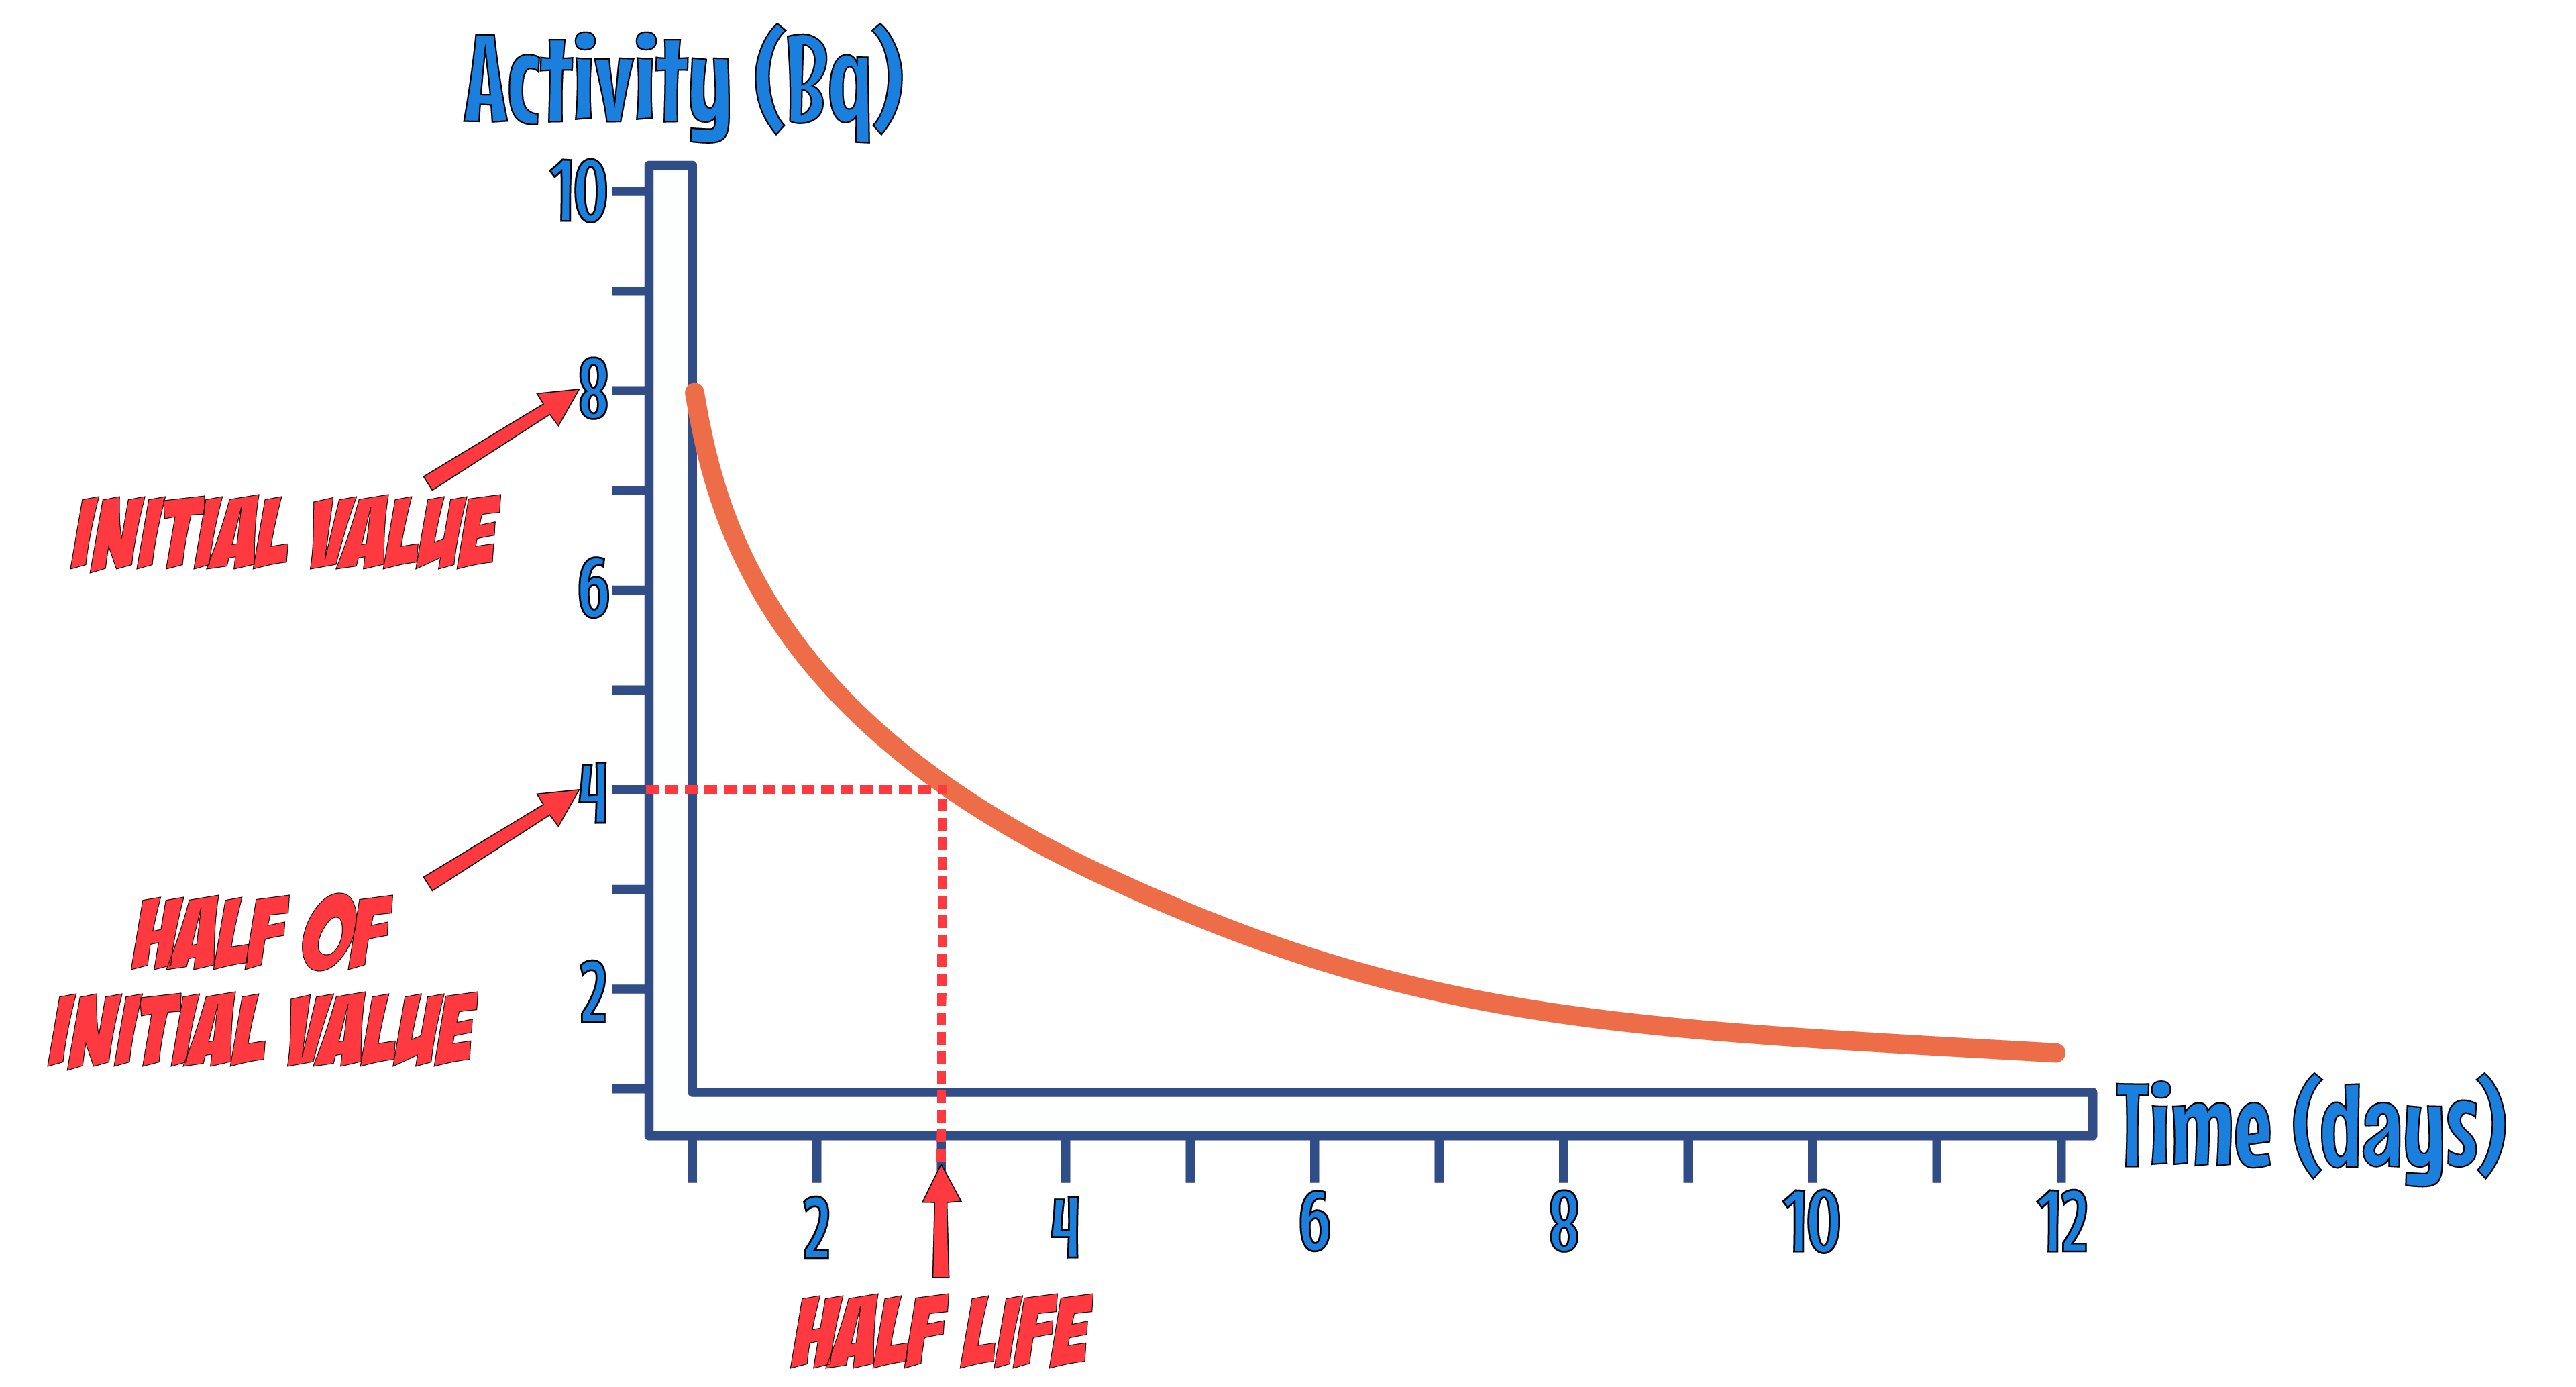
In the above example , the half life is 3 DAYS.